
0:34:38
Oh, I Found a Security Issue
Published October 26, 2026
DjangoCon Europe 2026
This video features Lais Carvalho at DjangoCon Europe 2026 in Athens, Greece.
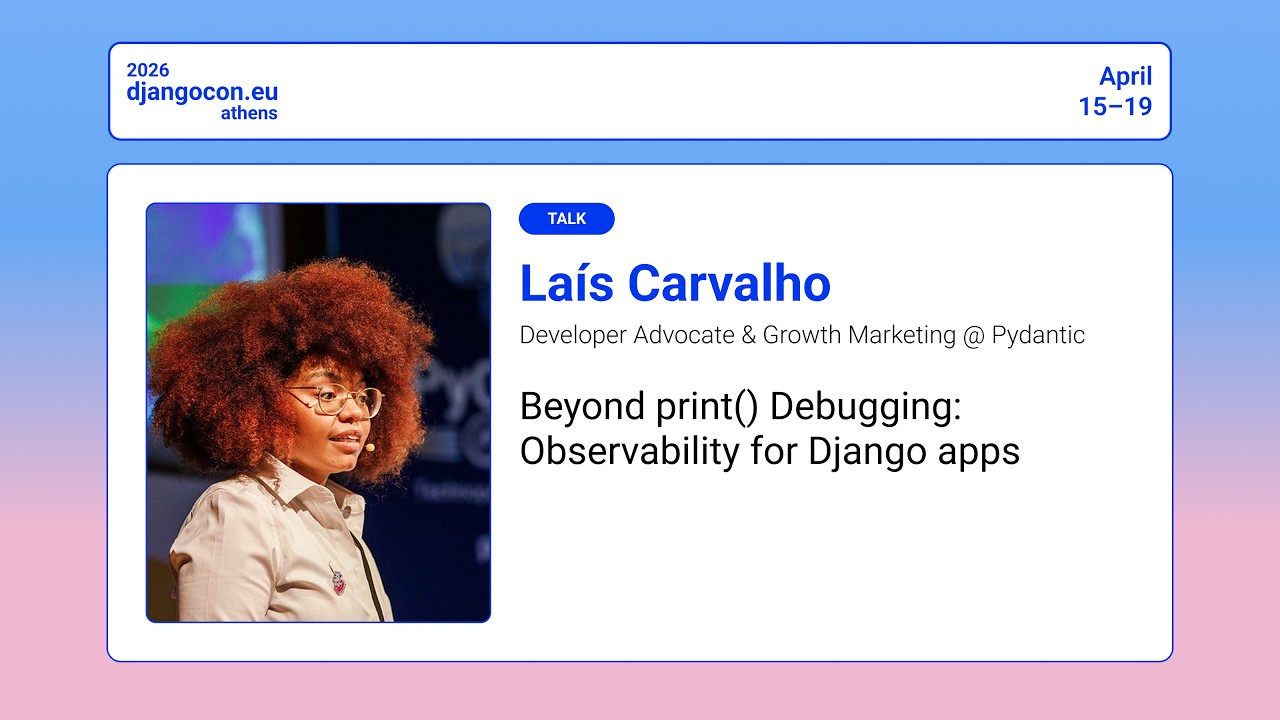
TALK: Beyond print(): Observability to debug you Django apps by Lais Carvalho
Most Django developers have been there: something is slow, users are complaining, and the first instinct is to sprinkle print() statements or scroll through server logs hoping for a clue. Without proper observability, diagnosing performance bottlenecks in a Django application (or any application, for that matter) is guesswork. Observability is the practice of understanding what is happening inside your application by looking at the signals it produces: traces, metrics, and logs. While the concept is well-established in infrastructure and DevOps circles, it remains under-explored in the day-to-day workflow of many Django developers. Yet Django's middleware architecture, ORM, and request/response cycle make it particularly well-suited for instrumentation. In this talk, Lais Carvalho walked us through how to add observability to a Django app. She covered the Four Golden Signals of observability (latency, traffic, errors, and saturation), explained why they matter for your Django app, and showed how to expose them with minimal setup.
More information: https://2026.djangocon.eu/speakers/L9XBYZ/
Follow DjangoCon Europe on social media:
*X - https://x.com/DjangoConEurope/
*LinkedIn - https://www.linkedin.com/company/djangocon-europe/
*Mastodon - https://fosstodon.org/@djangoconeurope
#django #djangocon #djangoconeurope #djangoconeurope2026
Automatically transcribed, so expect mistakes in names and technical terms.
Speaker 1: So uh the next speaker is uh Laís Carvalho. She's uh a developer developer advocate at Society fellow and a community award recipient from the PSF. At the same time we're also starting the works up downstairs. So welcome Laís. Thanks a lot for being here.
Speaker 2: Thank you.
Speaker 1: She's going to talk uh how to start debugging applications not just with print which I'm sure that all of us are doing but let's see if we have more interesting ways to uh start understanding how our application works And uh yeah, thanks all for being here and welcome to Athens. Lice.
Speaker 2: Thank you. Uh hello everybody. Just one second so I can Fix this thing and you were announcing the workshop.
Speaker 1: Yeah, there's also a workshop happening downstairs from Daniele Prosida. I do not remember the name of the workshop. How to understand them the employer 's perspective when you apply for a job? So if you're looking for a job, maybe you need to go there. If you look Using a lot of print for debugging, maybe you can stay here. Either way, you will enjoy the conference. Thanks a lot and uh welcome.
Speaker 2: Thank you. Hello everybody. There's some folks um joining. Uh cool. Well good morning. We're all awake. Perfect. So let's start with this. So I will start with a little bit about me and why you should believe me today. So my name is Alice Carvalho. I am the founding DevRel for Pydantic. Who here uses Pydantic? Okay, like 40% of you. Alright, I can take that. Um well I nominate myself a observability nerd. Um I used to work as a site reliability engineer. and also a software developer engineer.
Speaker 2: And I recently joined Pytantic around like seven months ago I also do quite a lot of work for the Python community. I help Vicky organize My Ladies Dublin. I co-host some Python and data science workshops for complete beginners in Python. So if you also do some educational Python, please do come and talk to me Um I've done some organization for EuroPython, I've done some stuff for the PSF, and then last year I got an award. Um but nothing compares to actually convincing Guido to take a picture with you. Um so Cool. Uh a little bit more merchandising. So
Speaker 2: last time I was at a stage in Athens was in August last year. I was the opening keynote for PyCon Greece the first ever PyCon Greece. If you're curious about my talk, it is not a technical talk, but if still you're curious about my talk, that's the QR code. Uh and I would also like to tell you that the second edition of PyCon Greece is going to happen uh this year in October. Uh the CFP just opened a few days ago. So please do apply and if you have a company and you're interested in sponsoring, they're also taking sponsors. It's a really cool conference. It's not because I spoke at I spoke there, but it is a really cool conference, so I hope you attend. Cool. No more merchandising.
Speaker 2: Let's talk about observability. Um okay, so disclaimer, there are a lot of definitions. Around um observability. Um some of them are a little bit conflicting, so for the purpose of this talk, I am going to use the definitions from open telemetry But what is open telemetry? So OTEL for the intimate. Is an open source vendor vendor neutral observability framework for handling application telemetry. So basically you do logging on your platform
Speaker 2: and you need to have then a shared understanding on how that data travels through your different systems and how different vendors actually um show that data on different observability platforms. Open telemetry is one way, the main way to do that. It's a very large ecosystem. It supports more twelve more than 12 different languages. It has plenty of collector components, more than a thousand integrations, and you can see loads of vendors. This screenshot was taken from the hotel website. Perfect. So then what is observability? Observability is the thing that allows you to understand the inner works of a system
Speaker 2: from watching it from the outside. So it helps you understand why. Something is happening the way that is happening. Which is something that we always try to understand when you're trying to debug things. Why is this thing here? Why is this happening? Why is this failing? Why is this not failing when you should be failing? It is very for observability to be useful, you need to have proper instrumentation Instrumentation then since we're talking about definitions is the code that you add to your application to allow for those telemetry signals to be collected. At the end of the day, it's all about signals, which can also be called symptoms, and
Speaker 2: what caused them to appear It's also valid to remember that OpenTelemetry has some semantic conventions that are applied for the way that you transmit that data. So you have consistency across all that telemetry data. Okay. So Three base pillars of observability are logs, traces, and metric. So and again, it's all about collecting that data, visualizing that data in some shape or form, analyzing that data to understand what caused issues, and then Also understanding what's the impact.
Speaker 2: Cool. So um who here knows what a log is? Show of hands. Okay. There's 20% of this room that is telling me that they know what a log is. Um so we're gonna have to spend a little bit of time here. So cool. So um Data structure is a list of tuple. You have a daytime, which register the time that something happens. Um, you have a level That is usually well debug, info, warning, error, or critical. And you also have a string that usually carries a message. That tells you what's happening in there. So here for example, we have
Speaker 2: several tuples. You can see Several different levels and right over , see if this works. Right over here we have, is it working? No. Let's try this way No, let's try that one. No, yes. Okay. Right over here we have an error. Which is payment failed insufficient funds. Then I have a question for you. Who here can tell me? to which of those post requests on warning levels that error belongs to Exactly, thank you very much.
Speaker 2: Depending on the daytime, you're never actually going to be able to tell. And this is the problem with log and print statements when you're trying to debug things. It is the wrong tool, the right tool for the wrong job. The wrong tool for the wrong job. Basically, you're trying to show relationship with a nested with a flat data structure. It can do it, but it's gonna be a painful process. So okay, what should a log look like then? I present you the class log.
Speaker 2: We have then a typed dictionary. Which is well going to allow you to nest things then within. You can see now that we have two timestamps, a start and an end. a message which we had before um some attributes and ta-da children uh The fact that I can then have children of type log inside of that class basically means that I can Yes, nest them. Um so now here you can see that
Speaker 2: well I have my start and then date Um of type type data time. I have my mess, I have my post requests, which are my payment. And then here I have that very clearly nested within My payment failure log. So I can very easily identify which post request relates to that payment that failed. Another really good thing about this is that since I have start time and end time, I can also calculate the duration of this request. So this looks a little bit more like a tree of function calls with timing information.
Speaker 2: And we call this a span. A collection of spans, you can also you can see they're all nested, is then called a trace. And again, you know so usually you have traces identified by trace ID. You can have several different spans inside, you have one trace parent with a trace ID, then you're gonna have your different spans with different spends ID, but sharing the same trace ID because they all belong to the same parent. Um basic nesting. Cool. Here I have a Small.
Speaker 2: Live example of a trace. So here basically you're able to see this post request That is successful and the 25 different procedures that went in, including this error, um, to actually give me a successful output. And here you can see that this took 2. 18 seconds and you can also see the breakdown of each one of these steps up to the two seconds. Um Perfect. Then I have metrics. A metric is basically a collection of data points at specific intervals.
Speaker 2: When you store those um data points with timestamps, they can become time series. Not all time series are metrics, but all metrics are time series. Yes. And they're usually used to show trends across systems. Here I have an example of a metric with the trace that we just saw. So we have a PNT 5. in seconds of specific requests for the same application. And here you can see this specific post request
Speaker 2: that took 2. 18 seconds. So trace shape with duration and then metric shape. Cool. So um one of the most important distinctions to make when you're observing a system is What is happening indicated by signals, symptoms, and from Why something has happened, which is known as causes. This is basically the distinction that I like to make for monitoring versus observability. This is not a given truth. Different people define monitoring and observability different ways.
Speaker 2: But since this is my talk and I'm the one speaking, this is my definition. And ideally you need both. I took this from the Google SR ebook. um this very clear distinction between what's a symptom and what's a cause. And there you can see, for example, that if you're serving a bunch of error um HTTP requests, one of the which is a symptom. A cause could be a database server. There is refusing connections. If you have Response is being very slow. It could be due to uh CPU overload or a problem on your hardware. You know, anyway, you you get the gist. Um
Speaker 2: Again, causes are much harder to identify because you need to Understand you need to interpret your systems to understand what's the cause. You need to interpret your symptoms to understand what's the cause. Cool, so we're here, there's a bunch of theory. Um what can you take home? Why does this matter Where can you start then applying observability into your application so you can see some system health? Well. A good place to start is with what we call golden signals of observability. There's four of them.
Speaker 2: We have latency, which is time to serve requests, usually measured in milliseconds. You have traffic, which is an indication of the load in your system. um usually measured by requests per second. So you can have number of queries on your database per second or number of HTTP requests per second. Um you have your rate of errors as well. Ideally, you should also track how many exceptions And if you have any timeouts. And last but not least, you should also track your saturation, which is how full your system
Speaker 2: is. A very common metric for saturation is CPU utilization or memory utilization, and it's usually given in percentages. I have some examples of this at the end of the class. talk. Um how long do we have? Okay, we still have we're still good. Um perfect. So as you saw on our opening keynotes today, it's quite impossible to talk about application these days without talking about AI. As Pydentic we say that AI is still just engineering. So the same rules that you use to Trace to observe to monitor your application, uh also carry through to AI applications, um, but you also need
Speaker 2: another layer on top of that. And the reason for that is because Software, regular software, is deterministic, which means that when every time that I have an input A, I'm going to have an output B, but AI is non-deterministic, which basically means that I can have an input. a specific input that when processed produces a another specific output. But then the same input when it's processed by AI then gives me a complete different output. Um that layer on top of observability. Um Should then ideally tell me
Speaker 2: how much money I'm spending with my AI calls, how many tokens I'm consuming, and also how accurate the replies from those LLM calls are. For request calls and tokens and costs, uh we have a specific LL um open LLMetry. things that we can add to it. But uh I just want to touch on the fact that if I'm trying to identify if An LLM is giving me a proper reply to something that I'm trying to do. A good way of determining that is by using evows
Speaker 2: Which is basically evaluation measurements for AI systems. There are ways to set this up that you can use what we call LLM as a judge That you're going to use LLMs to judge the output of LLMs, or you can also create your own custom evaluators Evous is the bitch of observability that goes straight across with data science, with data science. It's a huge field and if you are building with AI. And you want to learn more about this, I would recommend that you have a look at things from this guy called Hamel Hussein. He has some
Speaker 2: really good um content on how important evals are and how to build your own custom evaluation metrics for what you're trying to accomplish. Cool. Then here I have an example of a trace That shows an LLM call. So I have here some exceptions and then here I have a post request uh to generate something with a prompt catch that is successful and that took twenty four seconds And here
Speaker 2: all the different calls that I had to make. So it's an image. I made a call to OpenAI. I have an image generation. Here then I downloaded and saved this image. This is how large the image is , and then the successful message. And again, the breakdown of how long each step took. Um This is a very very general I I don't I don't know if you can see it, um, but this is a very general um idea that of other things that you also would like to measure um when you're dealing with LLM calls within your system, which is
Speaker 2: Um cost over time, how many times you ran, um how much on average those LLM calls costed, uh how many exceptions you have Then just a few addendums. So here we have a diagram from open open LLMetry. um on instrumenting your application, uh your LLM call, the client of it. So um Your request, how it goes to your motor, then the response, passing through your instrumentation and going back to your application.
Speaker 2: I also want to mention that type safety is very important for AI application in general. And if you're curious about how important it is or like the bare bones on how to set it, um I added a article. They are from a guide that now works as developer experience for OpenAI, talking about the different ways that you can use type validation to make sure that your LLMs are Better, more reliable. Um and then I also wanted to mention that open LLM tree is a open source observability for LLM applications, so it's just that layer that goes on top of Obitelemetry
Speaker 2: to make sure that we have Semantic um standards um to trace LLM traces and vector DBs Um cool. Then I have a little bit of a demo. And I'm on time. I'm impressed. I rehearsed so many times and I was always out of time. So it's good. Um cool, so I built a Django app with an agent, Penetic AI agent, that generates images if I open AI GPT-4O model um and it's fully instrumented so let me see if I can show it to you. Let's see.
Speaker 2: First You're gonna close and here we go. Perfect. So uh this is the code Right, so um using logfire um for open the lamage for the tracing. Um you can use I'm using LogFires SDK because I like it. Uh but you can use OpenTelemetry SDK, you can use your preferred um observability tool. Then here I have my agent.
Speaker 2: So I'm initializing that agent. I'm using OpenAI responses model to generate images of medium quality. And this is my system prompt. So basically we're gonna add an afro hairstyle because I want everything that we input to have a hair like mine Then I have a generate and save image method. It's not the best code I've ever written, but anyway. Then here I have a specific span for the agent run. We're going to be able to see it in a second. And this is the name that the image is going to have once it's generated And this is the message I have
Speaker 2: on my telemetry data. Then here on my application, I want to show you How the instrumentation actually works. So here I have instrumentation for Django. There is showing me all the headers. I also have instrumentation for my database And my patent instrumentation. And also I want to expose some system matrix. So I'm out of the box just pulling in some instrumentation for system matrix. Cool. Then let's see. This is this right, yes
Speaker 2: Um let's go here. We're going to show the last 15 minutes because I want you to show just To see just one trace, can you see? Yes, you can see this. Cool. So this is my Django application. I have here this tab with AI tools Um, I have an image generator. I have an idea for a prompt, but can anybody tell me the name of an animal? Like any animal, just shout. pony so I am gonna love this so cool so we have a pony is this how you ride pony Ah yes. Thank you. Perfect. So we're going to generate this image. So here you can see
Speaker 2: this is my trace. You can see here your request. It's waiting. I have the image generation in a queue. These are all the requests that my system is making trying to retrieve that image, see if it's ready. You're able to see here that it's processing. Um tan tan tan then there we go. I have my pony here. Um here you're able to see, let me just make this. Here you're able to see how many tokens I spend, so input and output tokens, how much money this costs, this specific call.
Speaker 2: Pony image. Wow, this is so cute. I know. We can also see it here. Um Yes, so this is just so I can show you how ponies look when they have an afro. Uh no, this is just to show you how the telemetry actually works. Um I am then just going to show you super quick um Simple stats on all the agents that I've run. So I've run this thing 34 times in the last 24 hours. I did have a little bit of stage fright. I spent 11,000 tokens
Speaker 2: at a cost of four cents. There was eight exceptions. You can then see the list of all exceptions that was yesterday when I was fighting. This is the average latency for my calls, token usage error count. You got the gist Then I would like to show you as well my system metrics. So with that setup that we did on PyCharm by adding these I'm able to pull those in, obviously writing some queries. But then here I have process count for my CPU, a saturation metric for my CPU as well. Another saturation metric for memory, and you can also see I haven't used any swap memory.
Speaker 2: And it's also interesting to show that Again, those metrics can be repeated across your systems. So here, well, since I deployed this in render. I also have some logs in render, but you can see here that is the default way that we look at logs. So there is sequential, it's a flat view. But I do also have some metrics. There are system metrics, they're out of the box from the deployment platform. Yes, so this is Dash and then to finish this presentation. I'm not even sure how we're doing for time. Um Two minutes, amazing. So just to finish this presentation, I
Speaker 2: so this is a little bit of a view on how observability is working at the moment. So you have we have Many different platforms that look into different parts of systems. So we have infrastructure monitoring, we have what we call the APM, which is application performance monitoring. We have user experience platforms, we have a lot of observability. In my view, the future of observability is a unified application platform that we can actually query and understand what's happening with our systems by looking at one place. So instead of spending money on twenty different observability platforms, um I'm hoping we 're going to have this system, this utopic system,
Speaker 2: that you we're going to be able to have some understanding of actually what's happening in our platforms by writing a SQL query. Um anyway, this is me, Esharisopoli. Um Kid Habru, the slides. Thank you. We have time for one.
Speaker 1: You can do one more one or two questions uh thank you very much uh lais for this presentation if charisma polli uh so do we have any questions from the audience I think it's it's okay
Speaker 3: Thank you for the talk. So you mentioned observable observability uh for AI. But what about the opposite? So using LLMs for observability, yeah to interpret your logs, traces and so on. And to you know return some results automatically.
Speaker 2: So one way I've seen this being done, so well it's always always going to depend on how you do your instrumentation. So the better your instrumentation is , more granularity of data you're going to have, and better are going to be the chances that you're going to be able to catch errors or debug your application by looking at your telemetry data. One of the ways that I've seen this being done quite successfully is with MCP servers. So basically you're able to copy your trace ID or your span ID and say I'm seeing this exception, I don't know where this is coming from. Look at it for me. Improve my code. Request is taking 30 seconds. Um this is not good enough. Make it better. How can I make it better?
Speaker 2: Make it better for me. Um this works. The platform that I'm using right now, Logfire, does have uh support for that. The problem that we're still seeing with MCP servers is that they fill up context window quite fast Um, you know, there are ways that we're also working to make that better by, for example, um caching some of that or using sandboxes, uh LLM sandboxes to actually process those um context windows, but sorry, to process that uh code But still, you know, we're getting there. Um does this answer your question? Yeah. Thank you
Speaker 4: Uh thank you for your talk. Um do you also have recommendations for tools you can use to uh develop observability locally? Because Like there are web platforms that you can have observability too, but it is also very nice to have a high fidelity system where you can view the logs coming in directly locally. Are there some S
Speaker 2: sorry, I am not a hundred percent sure I understood your question. I'm so sorry. Can you can you repeat it?
Speaker 4: Yeah. So are there uh so for email for instance you have mail hoc where you have a local SMTP server? Are there also local tools you can run as an observability platform without having like a platform in the cloud but just locally on your machine?
Speaker 2: Yes, yes. So um Well, you can use You can use um there's some open source solutions for Dash. Um Like you can use the Eager. I am I have never used Jaeger, so I'm not 100% sure if it's local or if it's in the cloud. Um Let's that can be a really long answer, so I reckon it's better if we take this um offline. Um but I can show you some solutions, some things that are in my head right now. Uh sorry. Thank you.
Speaker 1: Thank you very much. I think that's all. Thanks again for uh the nice presentation. I will say that it was a lost opportunity not to have uh a unicorn a Django unicorn as the as the animal. I mean no nobody nobody thought of that that's okay um thanks again
April 15 - 17, 2026
Athens, Greece
Note: We understand that names change, people change, and bodies change. We respect each individual's journey and privacy. If you have any concerns about a video or need us to remove content, please don't hesitate to contact us. We will handle your request with care and promptly address any issues.
Published October 26, 2026
Published October 26, 2026

Published October 26, 2026

Published October 26, 2026

Published October 26, 2026

Published October 26, 2026