0:35:02
How to monetize your side project for fun & profit
Published July 10, 2024
This video features Wilhelm Klopp at Django Day Copenhagen.
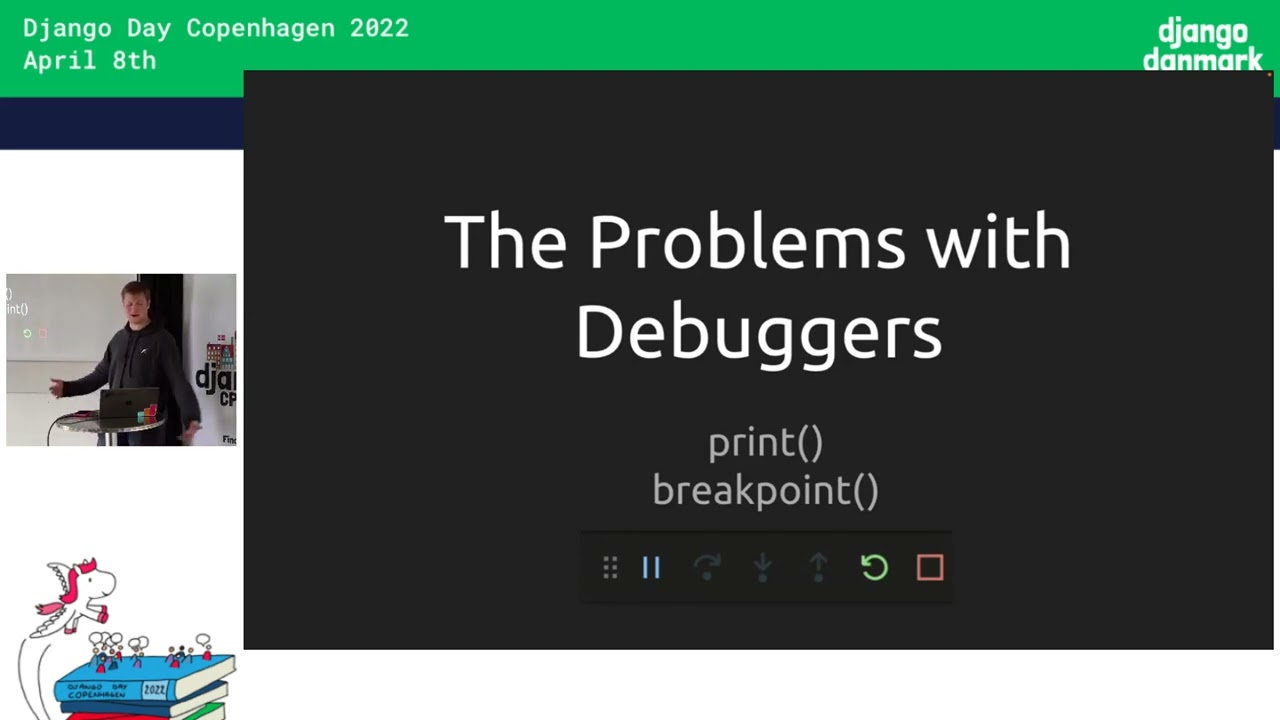
"Kolo: Understanding everything your Django app is doing at runtime" by Wilhelm Klopp at Django Day Copenhagen 2022. Talk description at: https://2022.djangoday.dk/talks/wilhelm/
Automatically transcribed, so expect mistakes in names and technical terms.
Speaker 1: So on stage we have Wilhelm or Will and uh you have also made a trip quite a trip here to Copenhagen and it's your first time I understand
Speaker 2: Yeah, uh second time in Copenhagen.
Speaker 1: But
Speaker 2: I'm always impressed by how uh friendly everyone is and uh all the bikes. Love the bikes Yeah, do bugs get stolen in Copenhagen? Seems like there's uh so many like
Speaker 1: Yes. Um and you're gonna tell us uh about colo and uh that's probably something that's new to a lot of people in the room without uh working directly with colour has anyone heard of colo before? Aha.
Speaker 2: Oh, there's a few folks. Yeah, nice.
Speaker 1: And uh really excited to uh to have you contributing this. Um So a big hand for a whip.
Speaker 2: Yeah, thank you so much, Ben. Yeah, really excited to be here and and talk to you all like you know we were talking about earlier. Excited to be back in person at these events and get some uh interactions and meet space. Um so yeah, I'm really been looking forward to this. Uh so yeah, so I want to talk a little bit about colo, which is um something we've been building, but I'm actually quite curious to Explain a little bit where where we're coming from with this. What's the problem we're actually trying to solve? And why is it useful to understand everything that your Django app is doing at runtime? So a little bit about me. I've had most of my experience working with Django with SimplePool. I've been using Django for about eight years now. So that's about version 1. 7 is the the first Django version I I use. So I kind of grew up with migrations already in Django and and learned to appreciate that.
Speaker 2: And it's been mostly for building simple poll. So simple poll is an app in Slack. If you've used Slack, you know it's very possible you've come across SimplePol. It's one of the most popular apps in Slack, you know, millions of users using it. And that's the most sort of the context I've been using Django in. And then I did spend a few years working at GitHub, which has a huge uh Rails app. Uh so I I have a couple of strong opinions about things where Rails is just much, much worse than Django, but also a couple of places where I think Rails is really good actually, and Django can learn some things from that. So if that's something that interests you, uh, you know, hit me up. I'd love to talk about that more. Um So uh yeah, so so where does that lead us? So um I wanted to kind of start a little bit with with this picture. Um because
Speaker 2: often when I'm when I'm writing code, I feel like I'm in this picture. I feel like I'm that guy. Um I'm kind of like rubbing my hands together trying to make fire happen. Feels a little bit like it can be so slow to create new new software. It feels like we're still in the stone age and there's so much more so much more we can we can do. But yeah, just feels feels slow often. And yeah, clearly we've evolved to make fire happen much more quickly. I think we can do a lot to also uh yeah, make software creation happen a lot more quickly. It's very interesting to me. And one of the times I felt most when like I was in this situation is when I was adding a new feature in GitHub. So this was at the time when I was working in the GitHub Rails code base. And it was my task to add a feature to show these uh CI failures
Speaker 2: on the files changed uh tab in in the pull request on GitHub. And it's quite interesting because I always think of one of the main features that GitHub provides is this collaboration on the code that changed, the collaboration on the pull request and diffs essentially. But as you can imagine, this code is actually um there's a lot going on. It's been around for like over a decade. Hundreds of engineers have touched GitHub's uh sort of internal representation of diffs. So I have a like a diff here. So this is just git diff, right? GitHub isn't involved here, but every single like character that you can see here, like you know, these pluses, these at symbols. This is all modeled like extensively inside this massive Rails code base. There might be like 20 different methods that just talk about like
Speaker 2: This number, right? So like that's kind of the complexity. So there's hundreds and hundreds of functions, lots of indirection, and now it's my job to add this new feature into this like huge amount of complexity. Uh and and you you know you read this code and there's all these anti-patterns. You're like, why why are we doing it this way? And then it's just a comment that says, well, like we tried all the different approaches and this is the fastest. Like that's why it works this way. And you're just like, damn, like all my mental models are falling apart. Like how do I, you know, how do I do anything here? All these edge cases that get handled for problems you didn't even know existed. So it's a it's a huge amount of complexity. So and and that's kind of what what led to Colo. Um but but before we go deeper into that, uh you know that was
Speaker 2: essentially the problem I had, but Here's the structure of this talk. So first of all, talking a little bit more about the problems with reading and understanding code, inspecting runtime data as maybe a solution to some of those problems. Uh and speeding up how quickly we can read and understand uh code. Then most excited for this one, um I'm gonna give you a demo of colour, the the tool we've been working on and just give you an understanding of what it can do today. And then also I'd love uh to end on this note, uh depending on how much time we'll have, uh this glorious future where we can collect, inspect, you know, visualize what our code is actually doing and how that can be a really useful tool for us. And I'd love to continue the discussion with you also after the talk. I'm sure many of you will have some thoughts.
Speaker 2: So let's get started with the problem the problems with reading and understanding code. So the thing that's kind of really interesting here is that I think from an outsider looking at our profession of software development, The output that we create is new code written, right? That's kind of the work product of what we do. You might see someone write 100 lines of code in a day, and that's uh their productivity for the day. But in creating code, there's this interesting dynamic where actually we read a lot more code than we write. So there's this ratio that for every single line of code that you write, first you have to read and understand 10 different lines of code. Which I think is kind of interesting because we have all of this extensive tooling to help us write code. But it feels like there's there's not quite as much, or maybe the tools aren't quite as good for really reading and understanding
Speaker 2: existing code. Like yeah, it's it feels like the dynamic is a little bit off there. And I think at this point you might say, well But I feel like at some point, you know, I I know the I I know my code base, I've read and understand uh understood the code. So I want to make the case a little bit that it's actually quite a common thing that you you You have to understand new code that you haven't come across before. So the first one here, you know, onboarding onto new or unfamiliar code, I think, is quite a common scenario, not just when you join a team or join a new company and you kind of have to ramp up on that. But I think as soon as you work in a team context uh where there's other developers working with you, um you know you might be on vacation for two weeks.
Speaker 2: And while you were away, your colleagues were busy shipping, merging, reviewing code. And now that code is kind of new to you Even if you have reviewed code and kind of were very f uh sort of intimate in the process of getting that into the code base, uh it might still be not at a level of understanding for you uh like it is for the author. So I think Yeah, it's just a very like I think as soon as you work in a team, you're essentially constantly uh onboarding onto new or or or unfamiliar code There's a couple other ones, yeah. Like I was saying, you know, this was my my case, understanding where can I understand and where can I insert a new feature that I had to onboard onto a lot of new and unfamiliar uh code there. I think there's also this interesting thing where um you know something happens during uh
Speaker 2: during a request that our Django app is processing. Like maybe we can see some uh SQL query logging on the database side and we know that this really big expensive query is getting made, or we use something like Django debug toolbar, and we know this you know big expensive query is getting made, but we just don't know where. So you know we have to ask this question like what's happening? Like you know, where is this happening? And then I think this this last one can be pretty painful as well. This might either be you know if your application is deployed in production or even um if you're just playing around locally. Uh sometimes our code can can or the code execution can reach a point where it it should never be able to go there. Like maybe you even look at the code and and it says like Sh this should not be possible. Or like if we got here, you know, something went terribly wrong. Um but the problem is you did get there and now you're asking yourself, like, you know, what the fuck's happening?
Speaker 2: So this is exactly what was happening to me. I think even day-to-day now, like uh working on the simple pull code base. It's interesting because I wrote a lot of that code, but since there is a lot of it, there might be a feature I haven't touched in like years or at least months. And I'm coming back to it and I think, wow, what's going on here? Like I it kind of has to it's almost like there's this RAM that exists in my brain. And I first need to like spend you know, four or five hours like getting all of this logic and these models and uh how it all works together like into my RAM and then I can kind of work with it. But fortunately, you know, after five hours the workday's over and you start again the next day Um or you know worse you get interrupted and uh you know and and then you have to kind of keep starting and it can be very frustrating.
Speaker 2: So I think this is interesting. I mean I I feel like this will be a familiar problem to you that you just need these long blocks of focus time. I think it's a really interesting question to ask. Like, what if you know you only needed like 30 minutes or an hour to ramp up on code? And then you could be really productive. I think you know, as a as an industry, I think we could become a lot more productive. Could be a lot more fun, I think, as well. And I think um what's interesting is that s a a big part of like this this idea of the the RAM and how you have to initialize your own RAM on unfamiliar code. is that we really rely on imagination quite a bit. So we ourselves we imagine how code executes. And that's kind of how we build our mental models. We're kind of pretending to be a computer a little bit. And again, if we kind of look at our our our editor, we have all this colorful text and beautiful syntax highlighting and jump to definition, but we're still manually executing what the code does or what we think the code does
Speaker 2: um which which you know the computer can help us with that. Now you might say um you might say tests we have tests And I think yes, tests are great. Tests can be super useful. But I think unfortunately you need to imagine it again if you were like coming onto an unfamiliar code base as a new developer. You um you kind of need to know about the tests in order for them to help you. Like yes, the tests might help you verify that something works a certain way, um, but if you don't know which tests relate to the code you're looking at, You're kind of back to the starting point, like, you know, what's happening? What what what test is uh you know what test could possibly help me with this? And well then you might say debuggers, we have debuggers. And debuggers are great. I love you know putting print statements everywhere.
Speaker 2: I love breakpoints. I love uh everything built in. Um I think the unfortunate thing or the problem I have with debuggers is that I feel like it's really easy to get to a place where where I don't really want to be, especially when I use the these bottoms tool, like a built-in IDE debugger or breakpoint. You know, I just hit the wrong character, I hit like you know, S or something, or maybe it was intentional and I tried to step into a function, but then I've hit enter a few more times and suddenly I'm deep in some library code that I don't recognize. And I'm like, how do I go back? Where's the undo button? Um and then I just uh hit control C and exit and start over, and it feels uh like not the greatest experience. So yeah, it's a bit too easy to get to where place I don't want to be in it can be frustrating. So yeah, I think there's a couple of problems with debuggers, and we can talk about all of them.
Speaker 2: I think the biggest problem is um The biggest problem with debuggers is they just ask quite a lot of you. And I think the biggest thing that they ask you uh ask of you is Where to start? Like where do I put my print statement? Where do I put my breakpoint? Like that's the point. Like you don't know where. Like, why why are you asking this of me, debugger? Like, uh, you know, why are you not helpful here? Uh so I think often what what I do, what a lot of people do is you set the breakpoint somewhere. You try, it doesn't work, you repeat. Maybe you even set 10 breakpoints, 20 breakpoints, and you hope you know one of them gets hit. But it feels a little bit like we're kind of flying blind um So I think that's the biggest problem with debuggers. I think they're super useful. Like if you already have a pretty clear idea of what you're looking at. If you don't have that very clear idea, I think it's less helpful.
Speaker 2: And then I think the other problem that that's quite substantial is that you get this kind of local point-in-time overview. And I think this is pretty helpful. Pausing your program and poking around like what's happening at this point in time. But it's not too helpful if you want to build up a more kind of a global high-level overview of what your what your code is doing. If you want to do that, debuggers can you know give you the sort of pieces. the the the the dots um but then you have to connect the dots uh the bugger doesn't really help much with that and so so what are the tools that we have for this for for dealing with this problem today of Getting a high-level overview, onboarding onto unfamiliar code. I think these are the tools. I think first and foremost we have, you know, we have a team. We work in teams. Often, sometimes we don't.
Speaker 2: Uh but you know, colleagues, they can pair with us, they can give us context, maybe they even wrote some documentation. Um and that can help us kind of get familiar, and that's I think that's great. This middle one might be a bit unusual, but when I had this problem of um working with with diffs uh at at GitHub, uh I came very close to just printing off all the code and like you know putting it all over my walls and just annotating, okay, this function goes here and then this goes there and then this loop gets called a hundred times. I think it can actually be quite useful just so that you can scribble all over the code. But yeah, it feels like it shouldn't be the best tool. And then I kind of already mentioned this. We have our brain, right? Our brain is is pretty powerful. So I want to talk a little bit more about that for a second here. So I think this is interesting
Speaker 2: because our brain does this stuff, right? So our brain, we kind of see what's happening, we see the dots, we look at the breakpoints, we inspect the data, we process all this information. In our brain, we kind of simulate what's going on. We try out these different conditions and branches, and then we filter out what's most interesting. We have like this mental model, and then maybe we draw some conclusion. Does this feel like Very similar to what a computer is good at, like processing lots of information, simulating lots of different punches, filtering. I feel like you know computers are good at a lot of these things. Um like why don't we why don't we let them help us a bit more? I think it's worth pointing out though that you know using our brain, using our using Teams, using the printer if if you feel it's helpful, it does work. But I think the problem is it's slow.
Speaker 2: So our brains are powerful, but it just takes time to build an extensive mental model. But I've worked with some yeah really, really, you know, productive um productive colleagues. who usually have spent months or years you know working around the code uh you know or the code base that I'm interested in. And they're they're able, yeah, to be really, really effective because they have uh they have less they need less time to you know get their own RAM set up. Um they maybe have some uh something loaded into like a very fast SSD or something that they can pull from. And and they have all this state in their head and that allows them to just reason and and uh reason about it much more quickly But the problem is that it does take time for these mental models to build. It's kind of one step at a time. You might start somewhere, you know, you start poking at the code, you make a mistake, maybe even break something in production.
Speaker 2: All of this helps with our learning, but It does just take time. And I think it'd be great if we could reduce onboarding onto a new code base from uh three months, six months to a week or an afternoon. Wouldn't that be fantastic? But yeah, so what do we do about all of this now that I've painted a terrible state of the world and talked about all of our problems? Well, I think like There's this interesting idea of inspecting kind of what is actually happening at runtime. And Python provade provides some really great hooks um hooks for this. If you're curious about how Cola works under the hood, Ian is in the audience. Um so hit up Ian, he's sitting right here at the front. Um and and we can talk more about that in depth. It's all pretty interesting. But yeah, this idea of looking at what our program is actually doing.
Speaker 2: Um and this isn't necessarily a new thing. Like the technologies kind of exist here. So you might have seen some of these, I think actually Century Datadog were mentioned earlier. These tools already look at at least what part of our code is doing and then extracting that information. So some of this question of what happened or what's going on can be answered with these tools. What I think is interesting though is um Uh actually let me show you this. So yeah, so this is what it looks like, right? So this is what this is what Datadog uh this is a trace of simple poll in Datadog. Uh you know, it took like 300 milliseconds. There's a bunch of SQL queries, then it ended with a request. Like this is helpful in giving us an understanding, like where um, you know, in a given request that's served by the simple Paul Django app. Uh yeah, well what's going on?
Speaker 2: Like okay, there's these middlewares and then there's these SQL queries and then there's a request to the Slack API. Like this is this is helpful. Um But these tools are largely built for monitoring, performance, uh profiling, and um and you know these very clear cases of there is an error, there is a problem, you know. This is helpful if you want to find a solution to this specific problem. But I think what I want to talk about and what I find quite interesting is this focus on understanding. Like very few, maybe yeah, really very few tools focus on helping you understand what your code is doing at a more global high-level perspective. Not how do I solve the specific problem, how do I optimize the performance in the specific thing, but hey, help me understand like what my code is doing
Speaker 2: Help me, you know, create help me create my mental model for for all of these things that's that are going on and that I can then use to be more um more effective. All right, so this has all been pretty high level so far. Um I think it a lot of this applies broadly to um to software development or you know broadly to web development. But I'm gonna simplify this a little bit for us and and make this all just a little bit more tangible. So we're gonna talk about Python and specifically we're gonna talk about Django. Uh you know, this is the Django day after all. And finally, we're actually not even going to talk about all of Django, but just about the HTTP request response cycle. HTTP is actually a great gift. Um great gift uh um because
Speaker 2: it uh it's this beautiful stateless protocol that helps us reason about just a part. of you know what our code is actually doing. So a request comes in, we serve a response, some code was executed in the middle. We actually don't need to understand everything at once. We just need to kind of understand what happened here. What's um or you know, over several requests, what happened in all of these. It's great because we can understand and learn sort of one step at a time. We don't need to know about everything that our code base is doing. We just need to take it one step at a time. So I think HTTP is an incredibly, incredibly useful. Okay, so this is where we get to the demo of Colo. Before we get to it, I guess a few words just to kind of introduce it.
Speaker 2: So the best way to think about colo, yeah, it's a tool that helps you understand what your code is doing. Um and the way it does that is is really two parts. So on the Python side, it's a it's a middleware, so you can you know pip install colo and then add it to your to your middleware list And then the other piece is a VS Code extension. So the middleware runs, inspects your code, collects all this information as your locally running Django app is serving requests. It saves that all into like a SQLite database and then um it's displayed and served up in in the VS Code extension uh for for you to you know get insights from. All right. So now we are going to look at the demo. Let's see how quickly I can switch this over.
Speaker 2: All right. Sweet. That wasn't the most painful thing in the world. Alright, you can all see this. I'm it guess it's quite small. This is quite big now. Um all right, so just to kind of set the scene here a little bit. Um So what we have here is is you know VS Code on the right and then we have um Slack running on the left. So I'm gonna use um I'm going to use SimplePol as kind of a demo case for how we use colo.
Speaker 2: In many ways, colo is kind of an internal tool to help us build simple poll more quickly. So what I actually am going to do is um Is is do something in sim uh on the s in simple poll, interact with simple pol. You interact with simple poll via SAC. Um and then what I'd like you to do is to look at this uh list of requests. So if you're unfamiliar with VS Code, you have all kind of these tabs here on the side. So you have the file explorer and you have search and you have Git. And then Colo is here and the kind of the main way colo works. is by um is by showing you a list of requests that the locally running uh Django app recently served. So I have Django running down here. I'm gonna get rid of that. Um and and then it shows you kind of historically uh the the most recent requests.
Speaker 2: The most recent one is at the top. So uh yeah, I'd like you to pay attention essentially to that list of requests. Because as I um interact with simple poll, uh my locally running simple poll, you can kind of see additional requests show up here, right? So I just asked, hey, please, I want to create a poll uh that fired off a request to my local simple pole uh to serve up this this modal which opened. Um and let me ask a question. So creating a poll which has uh you know really one option, let's be real. Um and then let me create the poll. So this created the poll, and now I can I can even cast a vote on it.
Speaker 2: And you can see uh all of the requests sort of coming in live as this is happening. So I'm gonna get rid of Slack now and we can kind of focus on just um on just colo So yeah, like I said, you know, you're kind of starting to get the idea that we have this these uh recent uh requests that uh went to um that went to our local Django app, and like Colo is kind of displaying them all. One interesting thing that might be different in your Django apps uh is that the way the Slack API works, they all kind of arrive at the same URL. Um I think this is common if you have like a you know GraphQL API, you have different queries going to the same place. If you're processing webhooks from any uh any place, maybe you know, if you have payments in your app and you have a payments provider like Stripe They will typically send all of the web hooks to a single URL. And then they all arrive in one place.
Speaker 2: Now, this can be pretty uh unhelpful if you then try and debug these requests. So one of the things Colo helpfully provides is this custom request uh description. So You can kind of see in gray, uh, it gives us a little bit of a better sense of what this request actually is. So we have a little bit more to work with, uh, rather than just the um rather than just the the the path and the the method and the outcome. All right, so let's dig into one of these. I want to dig into the poll that was created. So let's look at this one. So for each of these, you kind of get an overview of all the different basics. You know, there's a lot of stuff that you'd expect. Uh, you know, when was this? How long did it take, etc. ? Um the thing that I think is is really interesting is we kind of give you all of the all of the frames.
Speaker 2: So what a frame is, is kind of like the language from the Python internals, but you can kind of think of this as like every uh every function that was executed during during this request, all of your code that actually ran during the request. So we can go into one of these. Would be interesting. Maybe we go into this one. So this takes us straight to our code. Now usually on your screens I think you'd be able to see a little bit more here. Um maybe I can zoom out one and it would still be slightly visible. Is that all right? Can you kind of see that? Okay. So we know that this function was hit and actually colo provides these inline annotations and that tell us uh okay this function was called with with these variables and then later down we can also see
Speaker 2: here's the the you know where it returned So for this specific trace, for this specific um pull creation request, here is exactly which code was executed. And of course you can kind of click on these. Let me go on to the return one. Um and you can see all of the locals uh that were available. So this is this is all of the input arguments. So this is exactly all of the data that was passed in here from Slack. all of these different pieces of information we have access to. So the Slack user, the Slack team ID, you know, et cetera, et cetera. And then um Here is all the locals that were defined, and then finally here is what the return value was. So in this case we return a JSON response uh from Django. So for every single function that was executed during the request, we have access to this information.
Speaker 2: So the the thing I want to highlight here, and which brings us back to kind of the problems I was talking about. is if I'm a new developer on the symbol pool code base, I don't need to know about all of this code to start or you know all of these files, which files, which functions. to start understanding like what's happening, what's going on. All I need to to have running is you know a local version of of simple poll and then I need to just start interacting with it. As soon as I start interacting with it, I can start understanding, okay, this interaction leads to this function with this data. So this is what what colo gives us access to here. Of course, um let me close this real quick. We have the frames. We also have access to the SQL queries. So we can look at all of the different SQL queries that RAN, that that call sorry, that Django uh wrote for us and sent
Speaker 2: to the database. And then crucially, we can also see where they were made from. So this is a little bit small here. Maybe I do zoom in again. This is a little bit small here, but so every single SQL query, it tells us where exactly in our code was this query made. Um so this is uh making a request to user, it does a bunch of stuff, annotates. Um but colo helps tell us, you know, where is this coming from? So if we were uh you know curious about you know what the hell this query is taking forever, you know, 37 milliseconds and it's duplicated, why? Like where is it coming from? We can we can jump straight to where in our code that query actually comes from, which which is super handy. Now, this uh might not be relevant for all of you, but in the case of Simple Paul, much of what we do is actually send API requests back to Slack.
Speaker 2: And I think typically outbound HTTP requests tend to be, you know, are quite interesting. So Colo includes those as well. So we can see here, okay, we made, in this case, this would be telling Slack, hey, please post this poll in Slack. Um so here's exactly the the HTTP request that we sent us uh we sent um we sent back to Slack to create the poll. So if something looks off in um in in the output that we maybe as a new developer observe in um in in Slack in the actual output We can immediately go back to exactly the request that we sent and kind of find the corresponding bit and then work our way back from there. And we can also we can also see what Slack returned, which in this case is a very helpful okay true. Alright, so
Speaker 2: but believe it or not, I think this is actually not the most interesting bit of colo. So The coolest part of colo, in my humble opinion, is the the frame visualization. So can I zoom this out? Let me recreate this. Okay, we can see a bit more here. So kind of a reminder again, this is um the this is the request to complete creating a poll in Slack. And this is what it looks like. So uh Every node you can see in this graph is essentially a function call. So I can hover over these and see this is where it kind of started, this poll action that returned that JSON response. But kind of we can get an overview about everything that's kind of going on in the course of the request.
Speaker 2: The white uh nodes are just your code, uh your function calls in your code. Then the green ones, um, so this one for example, is the beginning of a salary background task. So everything that comes after here is uh is happening in a background task. And same thing here, we kind of start a background task, and then you know all of that happens happens afterwards. The blue lines are an HTTP request. So this would be the place where we then actually make the request to post in Slack. And then a newly available and not yet released The purple lines are all the SQL queries that get made. So you can kind of start, again, starting kind of from nothing, you can get an understanding of here is everything that's happening. Everything important that's happening
Speaker 2: during this request. You can see kind of where do the most SQL queries get made, uh, where are the background jobs starting? Um one thing I've noticed and I found incredibly useful actually is There at least the way kind of our code seems to be mostly structured is that there's a there's always a bunch of stuff going on and a bunch of kind of checks here at the beginning. You know, is this routing, is this user allowed to do this thing? But then there tends to be this one main blob uh which kind of coordinates most of the work. In this case, we actually have two. So we have this one here, complete poll creation. And we can obviously jump straight there and then go and explore all of that. And then we have the second one here, which is the background job to kind of post it in Slack. So we get kind of an overview of everything that's going on.
Speaker 2: We can jump to the SQL queries, we can jump to the HTTP requests. And then also you can see down here we have a um a flame graph. So The this visualization at the top, it kind of gives us a bit of a spatial layout, like what are all these things that are going on, which function seems to coordinate the most work? And then yeah, like I said, this this tends to be a good heuristic for me when I'm refamiliarizing myself with something. Um, you know, this this is the You know, where do I need to go to make my change? Well, the function that coordinates it is kind of a good place to start looking and then re-familiarize myself with all that's going here. And often I tend to add the you know whatever new feature it is. Um in in one of these functions that coordinate a lot of work. This would be another example here, you know, post-creation logic. But yeah, then we also have the flame graph down here.
Speaker 2: So we can kind of explore a little bit. What's taking the most time? And obviously, especially with the internet here, it seems like the HTTP requests to Slack are taking, you know, almost uh almost a full second down here. Um but it you can also dig in and zoom in and see, okay, interesting. So just saving the poll, that that's a couple of requests, you know, here and there. But yeah, you know, going back to this idea of understanding, you just start to build a picture with all of these various tools, either at the very specific level or at more of the global high-level um uh high level uh level uh uh about what's actually going on uh in the code. You can start kind of from from zero. Now I want to show one more feature which is also Uh unreleased.
Speaker 2: Actually might be released, but it's hidden. So imagine, yeah, imagine again you're um you're sort of new to the code base and you're investigating uh and you're trying to figure out Uh what does this function do here? Right? So yeah, I mean I'm not expecting you all to kind of understand this right now, but this is a function, you know, is standard emoji for for action ID? Uh what does this function actually do? It looks simple enough, but it's it's a little bit weird. Um and you can look at the example here. Uh at so yeah, let's take a look at this. And we can see that it was called the the input arguments were ID one and then emoji one and then it just returns true. Okay, interesting.
Speaker 2: Um, but what about when this function doesn't return true, when it returns false? Like what would need to happen so that this function would return false? Uh well What we actually can do by just recording all of these traces over time is we can show you not just information from a single trace like a poll getting created, but we can also show you You know, any examples we have of this function getting called. So if I hover over this, I see here that Colo has actually 74 examples for us of how this function is used in practice across um All of the you know locally served requests. And fun fact, you actually can enable colo in your tests as well by setting the debug mode flag. Colo runs only when when debug is true. In tests, by default, debug is false.
Speaker 2: And uh uh but if you you know pass that flag then um uh then cola will run for your tests. Uh which can be a great way to kind of seed your database with all of these different examples, especially if you have great code coverage. So I'm just going to click on these examples here and that opens up another kind of tab with many different examples of how this function is called in practice. Now, again, this is still not very helpful because we get past one and one and then it returns true. But what I can do here now is I can search for return false. And now interesting, we see something here. So we see action ID four and then the emoji is pizza. Now that is kind of breaks the pattern. We always see three and three, you know, five and five, and now here we see four and pizza.
Speaker 2: So now this might be Obvious if you are, you know, if you wrote the code, I you know, I wrote this code, it might be obvious by reading the function closely, but it's just so helpful to see like an actual example. Like when would you know, it not be two and two. When would it not be five and five? Well, it turns out you can have four in pizza, and that's when this function would return false. And that's um uh and that's now strengthened your mental model a little bit and and kind of got you a little further on that journey of understanding. Alright, so uh I am now going to go back to the last slide and talk a little bit about the the glorious future of um uh of inspecting our code at runtime. All right. Where are the slides?
Speaker 2: Hmm, slides are gone. So while I get this back up, I think essentially what what I want to say with with this is um You know, I think some of these explorations with with Colo uh are oh crap There we go. So oh now I'm at the now I'm at the beginning. Oops. So yeah, what does the this glorious future of expect inspecting our code at runtime actually look like?
Speaker 3: your screen again sorry
Speaker 2: oh is it not working
Speaker 3: yeah you just done yeah and share screen and okay and then that one over there
Speaker 2: perfect lovely so working
Speaker 3: perfect thank you
Speaker 2: Yeah, okay. My notes aren't working. Anyway, um so yeah This this idea of like, you know, what does a future look like where we have where we can look at our runtime data in this kind of way? Like, so I think some of these things that Colo can do are are interesting, but I think there's so much more. Um if you imagine like sort of a storage layer that's always available to any running code, I think there's so many more interesting things that that we could do. Um like could we share some of these traces? With our team, and then we all have access to the same underlying database. And you don't even have to run tests to locally seed your examples. You just have them available immediately from the day you open your laptop as a new joiner. Or could something like Colo run as part of CI and tell us, hey, you know, your code looks great in your pull request, but actually you're adding like two SQL queries to every single existing test
Speaker 2: in the code base. Like, are you sure you want to do that? Like, you know, it slows things down. Like, it's surprising to me we don't have some of this tooling already, but I think it becomes possible if we keep track of what our code is actually doing. And staying in the world of tests, you know, these examples for functions, I think they could actually become great unit tests. We can take some of that data we collected at runtime and turn it into tests and then have that run automatically for us. Uh or even beyond unit tests. I think one of the most things one of the things that I actually enjoy least about software development is writing tests. Like I enjoy, you know, this is controversial, but like I enjoy building the thing and the feature and making it happen. And then you know afterwards I come back and now I have to like Do everything again, you know, write the write the test. Um and it's not even the assertions. I the assertions, writing assertions and tests are fine. What I find annoying is the fixture setup.
Speaker 2: Um you know getting all of the stuff in there and then making sure the test client has the you know the same request that I was already doing anyway locally Um and then writing the assertions is fine, but yeah, the fixtures is kind of what what I find annoying. But I think we are basically already collecting the fixture data by running um by by running colours so is there a way we can uh perhaps uh just save that data into a test and have that be a starting point for then uh you to write your assertions. So um I think that's a couple of ideas. I think there's actually many, many more. Uh I'm really curious what what you all think, uh, you know, and questions or even discussions uh later today uh or or uh virtually. Um I think yeah, there's a lot we can do here and and I'm really excited for for what this glorious future could look like.
Speaker 2: And then Last slide. So if you want to use colo, um colo. app is is the best place to get started. We are also on Discord. Um that's a great place to chat and have some of these discussions. colo. app slash discord. If you want to email me, email me Wilhelm at colo. app is a great uh great place to look. We are actually looking um for someone to uh join us. uh part-time on colo on Mondays and Tuesdays to actually work on kind of the front end, the VS Code side, the TypeScript side. So if you have experience with TypeScript, frontend and also Python, you know, and you want to do two days a week, then uh or if you know someone like that, please come talk to me. As I said, Ian is in the audience to talk about how Colo actually works Um and then also uh Kez and Jakob are here who are uh on the simple pole
Speaker 2: team with me. So there's a couple of us here, uh I'm sure we'll get to know you all throughout the day and and later. But yeah, thanks so much for your time. Great to be here with all of you and yeah, looking forward to the discussion.
Speaker 1: But we do and write on time as if we as if as in we do have time for questions. And I do have one little clarifying question, if I may start.
Speaker 2: Yeah, yeah, yeah.
Speaker 1: Colo is running as uh together with the Django dev server locally on the laptop right now. Okay. And you're looking to expand that into uh Multiple.
Speaker 2: Yeah, it's interesting. You mean like running on online or in the product?
Speaker 1: Staging in production and so on?
Speaker 2: Yeah, I think staging could be pretty interesting. I know actually we've had this come up recently internally for us. We'd love like if it was available in more places Um I think it's local for now because it allows kind of the most room for experimentation. Uh so we are still in beta, uh so I wouldn't recommend running it in in production. Um but it's pretty safe to do locally, right? Like all it does it's save some files locally for you and then if something ever was to break, just you know common and out and and then everything is working again. Whereas in production it'd be a bit more serious. I think like over time like we could go to these other environments. I think CI actually is I I think is quite interesting and maybe similarly safe uh as opposed to all the way to production. But yeah, I think it's quite interesting, but it might take a few years uh before we get to production.
Speaker 1: Um hopefully faster. There is also um uh Number of questions sort of the same category as um Jo is asking if there is a plan to have um an extension for the other editors, those that are not visual code. Um Will you be able to do that at some point? Do you have colo running like separately so you can build another IDE integration?
Speaker 2: Yeah, exactly. Yeah, no, absolutely. So the architecture definitely supports it. It's really like a nice kind of front-end backend separation. So everything is saved in like a local SQLite file. Like you can find the SQLite file, look at it. If you love writing SQL queries, you can Yeah, like visual like you can get the data yourself and even if you're say using Vim, um you know you can you can start like querying that SQLite file and get the data that you're looking for. It'll be a bit harder. But yeah, the architect definitely supports other um extensions. Like I think PyCharm is a very common request. I feel like if we were to build another one, that would probably be the first one. But I think even on even on the web could be quite interesting. uh like having kind of a a web uh solution so that you uh you could look at the colo
Speaker 2: 's output without needing to be on a specific uh IDE. For context, like right now the focus has definitely been to make this part of your development experience as much as possible, reduce the amount of context switching. Like you could see the whole demo was inside VS Code. jumping around various functions, opening up these files. It's it's intentionally built that way so that it can become part of your workflow as opposed to adding another window or another kind of tab onto it. So that's important. I I think actually what we might do is VS Code can actually run in in the browser. So we might build it in such a way that You can just see Colo 's output on your code base with VS Code in the browser. Like that's not as great as having it perfectly natively in PyCharm, but it might be a good workaround like
Speaker 2: in the meantime. It's definitely a lot of work to build another extension. So yeah. Um but it'll happen at some point, I'm sure.
Speaker 1: Um any questions from the audience? Yes.
Speaker 4: What's the overhead on running this? Like you talk about enabling on a test suite. I've got a test suite that runs for 10 or 15 minutes or something and I enable it for this, how how long is it going to run for a lot of time?
Speaker 2: Yeah, yeah, great question. Yeah, I think like um yeah it's interesting. It it definitely varies on what you do and how much work Colo does. And uh yeah, I think for the most use cases I'd probably recommend just using it on a single test or maybe on like a small app, like a Django app, and just populating it there. I think if your test suite is already 15 minutes Then yeah, we're not going to make it any faster. Um I think it's in in kind of local development. Uh so when you're processing one request at a time, the overhead is pretty negligible negligible. So you might go from yeah, like you know, 600 millisecond request to like 800 milliseconds, which for a single like that's a you know substantial percentage increase, but uh for yourself it's it's not noticeable. I think yeah if we want to do a good job at the full test suite
Speaker 2: Yeah, it's gonna have to become faster than it is right now. So there's some overhead, but there's also paths to uh reducing it if the test suite use case becomes like very interesting.
Speaker 4: If I'm only doing that to see the database, you can That's in a SQL file locally, then I need to do that once anyway.
Speaker 2: Yeah, exactly. You just need to do it once.
Speaker 4: Yeah.
Speaker 2: Yeah.
Speaker 1: There's one more question. I think we can make it the Last question uh before we go to the lunch break. Um like a quick one. Yeah.
Speaker 5: So uh uh I've been using Colo and at the same time I'm I'm trying to use uh sometimes uh Django debug toolbar.
Speaker 2: Oh yeah.
Speaker 5: It's uh bit of a weird interaction because uh uh sort of responsiveness really goes down the drain when that happens. Uh do you happen to know why or
Speaker 2: yeah good question. Yeah we need to look into that I think
Speaker 5: something that can be
Speaker 2: Yeah, so you're saying when you have both colo and debug toolbar, it adds a lot of overhead.
Speaker 5: Yeah, like a half second request turns into a and second request sometimes or something.
Speaker 2: Really? And when it's just colo, that doesn't happen. And when it's just debug toolbar, it doesn't
Speaker 5: uh when it's debug toolbar, it's debug toolboard seems to have a a lower sort of response time than than colo. It's uh debug toolbar is worse than colour when you're trying to get right yeah
Speaker 1: I guess a related question is how do we post feedback for colo when you're running the beta.
Speaker 2: Yeah absolutely I think the best part is in in the GitHub repository. Uh so opening a new issue there. I think the Discord is also a fine place to start. But yeah, clearly um there's some interesting things we can look into there. Ian's actually been working on performance for the last several months. uh you know trying out various bits with scython which is kind of new to me and very interesting. But yeah, like the interaction with debug toolbar specifically seems like it's again making things worse. So yeah I'm curious. Maybe we could do something there.
Speaker 1: Yeah. Yep. I'm sorry it has to be the last question. Um but give Will a big round of applause.
Speaker 2: Thank you
Note: We understand that names change, people change, and bodies change. We respect each individual's journey and privacy. If you have any concerns about a video or need us to remove content, please don't hesitate to contact us. We will handle your request with care and promptly address any issues.