
0:41:04
Beyond the basics with Elasticsearch by Honza Kral
Published November 3, 2017
This video features Honza Král at DjangoCon Europe 2022 in Porto, Portugal.
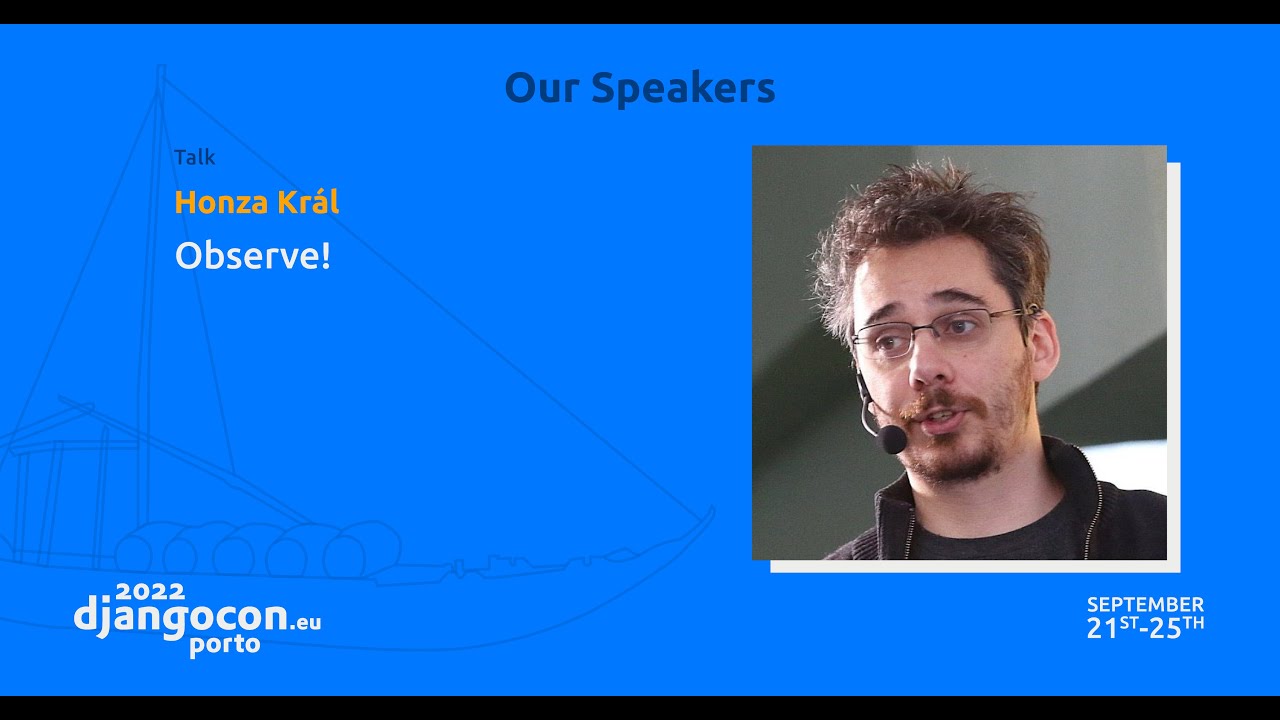
Observe! by Honza Král
We have a lot of great tools to help us develop Django applications, from tests to the Debug Toolbar. But what happens once you deploy your code to production? In this talk we will go through the options and best practices to make your production environment as friendly as possible.
Observability answers the questions developers need to ask about production systems without connecting directly to servers: is the service available, what is it doing, and how is it performing? Honza Král explains how structured logging preserves useful context such as users, request details, and trace IDs, making logs searchable and visualisable rather than an unusable wall of text. He compares basic uptime checks and system metrics with application performance monitoring, distributed tracing, and error tracking, showing how instrumentation can reveal database connection costs, time spent in Django or external services, network delays, and production tracebacks. He argues that logs, metrics, APM, and errors are most useful when correlated in one system and enriched with business data, and gives Elastic Stack, Sentry, OpenTelemetry, and hosted services as possible implementation choices.
Summarised automatically from the transcript.
Automatically transcribed, so expect mistakes in names and technical terms.
Thank you. Wow, that's loud. Okay, so as has been said, my name is Honza. I'm here hoping that everybody has a good conference And I'm here to talk about observability and what that is and why you should care and what are some of the best practices and tips and to get you started, essentially. So what is this talk about? This talk about uh this talk is about I wrote some code. It's running locally, it's running just fine, and that's not what we're concerned with. What we're concerned with is how to make sure that it continues running fine when it's not running on my machine in front of my eyes. How do I make sure that that happens?
Because on localhost, when we develop, we're used to all kinds of different tools. We have tests, we have uh profilers, debuggers, all of these things. I mean if you want to see something cool, I'm sure you've seen the colo stand just outside this room, which sort of highlights what you can do locally, how you can make your developer experience very good. But once you move into production, it doesn't really uh work those tools anymore They go away because they are not built for that. They require a lot of extra extra effort on the code point so that it's not really efficient or feasible to run them in production So what do we do now?
Well obviously for many people the first impulse is like we can just connect to the server, right? Please don't. Uh so first of all please don't but second of all sometimes that's clearly not an option because you might not have one server but multiple or you might be running entirely serverless, meaning on a server that you don't have access to. Uh so clearly that's not an that's not an option. But we still need our questions answered. And that's really what observability is all about, answering questions. We'll go through a few of the crucial questions now. that really are kind of important for for us all that run any code in in production But first, a few disclaimers.
I'm going to be using the Elastic Stack as an example of how this works. There are many other tools. I'll go through them towards the end. I'm I'm just using Elastic because I spent a significant chunk of my life at that at that company and it was just the easiest for me to choose and it's still free and open uh so I don't have to I don't have to pay anything. But moving on to the questions as promised, the first most important question is like, is it working? Is it even up? Uh can my customers, my users get to the code and is it is it still available? And this might sound like a simple question. It has a yes or no answer, but there are more nuances to it.
Like, is the server up? Is the web server up? Is the application up? Is it doing what it's supposed to be doing? Those are all different kinds of questions that are kind of part of this wider, is it working question, but require different tools, different approaches. even just to test whether people can access that server that can have many different implementations, many different answers. I mean, is the server accessible locally from within the same data center can be completely different from is it accessible from users homes from where users are. So always when you think about this question, you need to ask yourself first, what does that mean for my application?
Is it only an internal application, let's say an API for other services in the same data center? If so, then you're fine just checking it, checking it locally. But if this is a publicly available service for uh for other people, you have to check from where your users are Whatever that might mean, different data centers, different continents, other things. And you might also want to share that information with them. Anybody knows what this page is? GitHub status page. And this is uh I I have it here as an as a reminder that this is an information that's not just useful to you. But obviously useful to your users as well
where they want to know like is it is the problem on their side or on your side? I'm sure you've all been on the receiving end of this situation where you're trying to use a service, it doesn't work. And now, like, is it is it them? Is it me? Who knows? Well, the hopefully the status page knows. And it will it will be able to sort of short circuit this conversation, this internal monologue that you might have. So that's the to me this is the ultimate answer to the first question if it is working. If you can put together enough information to display a page like that that displays not only if the service is available But each and every individual function on the high level, whether it still performs, whether I can still create a repository, whether I can push, whether I can uh create an issue, those are different things.
Where that question still makes sense. Is it working? So uh that's that's the first question answered somewhat The second question is, what is it actually doing? I mean, I know it's up, I know it's there , but what is it, how is it spending its time and and what is it doing? Locally, when I do this, I don't know about you, but I'm a huge fan of print statements, well print functions now , which tell me exactly like where in the code things are In in production, uh we use prints as well, but we just call it logging. It's sort of the the prints that are considered okay.
But realistically it's the same thing. It's just a piece of code saying, hey, I'm here. This is what I'm doing right now. And that's pretty much it. Except if you just uh do that, then you get lost super quickly. You're faced with a wall of text. And that you have mixed things from different from different transactions altogether, etc. This is the simplest possible log. This is just log from an Nginx web server, so just HTTP requests But what you need to realize that in logging in production the the experience is different than locally. Locally you're the only user. When you see your your print statements
, they are usually represented from a single transaction, so you can see how one thing follows another. In this particular case, you would have things intermingled from different transactions, etc. So it's no longer useful for human consumption. You need something to make sense of those of those logs. And first, we need to sort of add some additional con uh context to the to the logs. So first actual tip , struct log. Is a Python library that uh allows you to have some structure in your logs. I assume it has something to do with a name. And this is uh something that allows you to say, uh
this is this is a message that I want to display to the potential unfortunate human who is reading the the log. But these are all the structured information, the context of it. And you can go a step further and have a f like a function like this. This is my real code that I use that I uh call from a middleware. Every time there is a there is a user logged in, I just call this piece of code and it makes sure that every single log statement then happens during that transaction will be annotated with the user ID, user email and all of these things. That way when an angry user starts yelling at me, I know why Because I can filter through the logs and directly search for their for their email or their user ID
and see exactly what kind of experience they're getting. and and know where the problem might be, at least where I can start debugging. And I can take it one step further, which is to uh sort of break down the individual log message. And even a simple log message like what I saw what I showed earlier at the records from uh HTTP server. There is a lot of hidden structure in there. For example, I assume most people here have seen the user agent string that browsers send. It's a piece of madness. I don't know why. I'm very sure many people here know why, but most of them say it's Mozilla. But it's not and
you don't really know how to interpret that, at least if you're anything like me. So instead what you do is you throw a piece of code at it that will let it parse And here you have a structured information that this was a request made from a Mac on Chrome and even the version of it, which is super important if you want to drag down a specific issue. So that's the that's the crucial lesson here. Always look for the structure. Many times when people do logging, They go from the structure into an unstructured text. Because in your code, you have the structure, you have the variables, you have different counters, you have information about what you're doing. And then you compose a very nice log message for yourself containing that that structure.
But that the structure is lost because it's readable for a human, but a human can only read one message at a time. That's not what we are after here. So use something that will allow you to preserve that structure. Struct log for Python, but there are many other approaches and make sure that that structure doesn't get lost in in time. So that uh configure struct block to log the data in JSON or some other structured format so that you don't have to keep you know serializing it into string and then parsing it back That's a waste of effort for both you and the CPU. And finally, once you have that structure, you can do things like that. you can you can throw it in a tool that can
that can work with that, visualize it, whether it's uh you know uh uh Jupyter notebook or in this case Kibana part of the Elasticstack. And this is purely the visualizations of the data that we've seen before, the HTTP requests. But we see where they're coming from because they contain an IP address which we can look up in a GeoIP database. It contains the information about how many requests, whether they were successful or not. And this allows you to sort of translate the wall of text into images because as humans, we're just very good at processing images. We are very bad at processing walls of text. So that's the that's the exercise here.
Preserve the structure so that you can get your images instead of a wall of text and can get something useful out of it. Like in this case you can immediately everybody here can kind of note notice a few suspicious things. There are a few spikes here and there. And you can see it immediately. I don't have to tell you even even where to look That's super nice. That's what we're after here to make it easily adjustable for people. So that was the question of what is it doing And here we're kind of getting into into the other question, which is how is it doing? So sort of uh quantifying how is it doing, how many requests is it doing, how fast are the requests what is the 99th percentile
s w meaning what is the experience that 99 % of the people have. And for me this is the this is the least interesting interesting part of observability because If you need it, you have it. Uh it usually is only interesting at scale, uh, because otherwise You don't really care that much and the other tools that we're talking about are more interesting because they give you more targeted information. For the metrics, you usually get pretty graphs like these, and you have many, many pre-built tools that can already collect and visualize these informations for you. For example, here this is just information from collected from a base system, just from a running Linux server.
So it just contains generic information about memory and network and CPU and things like that. It is definitely useful, but it doesn't it doesn't tell you anything specific. It just tells you that there might be some issue or that there might be something something suspicious, but it is by its definition generic You can get more specific with it and the more specific you get, the the more value you get out of it. So if you go from uh monitoring the system to monitoring uh the the web server, you get more targeted information. Suddenly you just don't see that you have uh too much CPU load, you see that requests are getting slower
That's much better information of course. If you go one step further and uh let's say monitor the the database or the or the web framework that you're using. I wonder what web framework people here use. Then you might get even more targeted information. And that kind of leads, this sequence leads to sort of leaving metrics behind a little bit. and moving to sort of the kind of the ultimate in observability, which is APM, application performance monitoring. That's actually unwrapping the black box that is your code and looking inside and seeing what is it doing? What is it doing well and what is it
doing wrong. That's the most important part oftentimes. So uh unlike the other sort of mechanics that I've talked to about uh until now. This is something that requires you changing the code a little bit. Essentially instrumenting the code, installing something in your code that will kind of sit there and observe what uh what everything what your code is doing. What is it talking to? What responses is it getting? Etc. This is where a lot of people get very uncomfortable for some reasons when you start sort of thinking about it, how this works. And the answer of how this works, particularly in Python, it's just monkey patching all the way down.
You install something in your code. You configure it and suddenly it will monkey patch all the known APIs, all the known libraries that it knows about, like Django, like requests. So if you do an HTTP request with the requests, it will automatically be captured. Or Psycho PG2 when you talk to talk to Postgres. That's something that makes some people uncomfortable, but it is super useful and it is sort of It is definitely definitely worth it because what it gives you in kind of the first instance is something like this a simple visualization of what your transaction looks like A transaction might be anything from
HTTP request to this, for example, is a salary task. So a background worker that woke up, did a task, and And manage to accomplish something. And we see a few things here. We see that it was a successful transaction. Go us. But we also see something very suspicious. I don't I don't think that uh you can you can read that. So just the first blue bar, it's longer than all the others. All of the blue bars in this case are are uh me talking to talking to a database And I included this screenshot because this was actually super useful for me because the first bar is just connecting to the database. It takes me 26 milliseconds to connect to the database, and then all the requests are
fractions of that. That's very actionable information. That's something that that's easy to fix. You just use persistent connections and you make sure that the connection is initialized before before you run. But it would be very hard to see without something like this. I would say almost impossible unless you knew specifically what you were what you were looking for. So this is kind of the quick win that you can get. And of course, uh once you once you start collecting this kind of data, you can take it one step further. Did you ever wonder what is the distribution of the time spent between your code and Django code and the database? Well, since we have all of this information, we can easily answer that question.
Because we we kind of know uh which part of the stack Django is responsible for. Uh we know all of your requests to the to the database or to third-party APIs or Something else. For example, here you can see I'm talking to S3, I'm doing some requests over HTTP to other APIs, and here I see a breakdown of where I s where my application, where my server spends its time. Is it running my code? Is it running Django code? Is it just talking to, waiting for a database to do its thing? And this is why I didn't spend a lot of time talking about metrics, but instead sped up for the APM because this is the kind of numbers, this is the kind of metrics
that you can get when you have a piece of monitoring, a piece of observability that understands your code, that sits inside your code and has this kind of insights. So super useful and you can already see how this might be how this might be actionable because you know that if it spends 90% of its time in the in the database or talking to third-party APIs, there is no point in optimizing the Django code. There is no point in optimizing the Python. outside of just looking at what what are the requests that it's making and whether it's uh possible to optimize those. So it's uh immediately sort of visible
And you can take it one step further. Nowadays, to Disappointment for some. Web applications are no longer just simple, you know, request response, server static HTML, call it a day. We have we have application code running in in the browser as well, and that's just when we're talking about web applications. If we're talking about other things, it gets even more complex So what you want to do there is you want to monitor start-to-end the entire journey of the transaction where it starts on the br on in the browser, what the browser does, uh the the resources it it needs to load, the rendering
it needs to do, and then what are what is the code in the browser doing. And if you then connect it, you have a graph like this where you see the entire transaction in the browser. And you can see the API calls that it's making to your server. And you can see it all in one picture. This is called distributed tracing. And and for anybody interested the way it's done is it just injects special HTTP header. The the code that monkey patches everything just puts in a little HTTP header to all the outgoing requests and looks for the header in all incoming requests and then uses it to correlate uh these different these different transactions into
an overarching trace. So here you see some front-end code running in the browser, reaching out to the back-end API, the back-end API talking to the database. And you see all of that from start to finish. And here again you can see that there are some information that would be very hard to get otherwise. For example, from the point of view of the front-end code, the transaction took, let's say, 100 milliseconds, the call to the back-end API. But what was visible in on the backend API, what we thought how fast we did it, was just 40 milliseconds. So where did the rest go? Any guesses?
Network, yes. I I don't know about you people, but I'm always surprised that networks are not instantaneous. It it really it's it's unfortunately I I wish that was a joke, but no, every time I realize that that really there I need to account for that and it's you know it's not just what I see uh other people see It takes a while to adjust to it. And something like this, something like this helps. So this is sort of the the ultimate in what I would say the the observability. You can see exactly what's happening from start to finish. You can see what uh what um experience your customers have. And you can also, if you do your logging right, if you uh
if you remember I had a slide there saying context is king. So if you take this trace ID that ties all of these all of these different transactions together and include them in your in your logs as well. Then you can easily say, okay, I see this transaction. I don't like something in there. Show me all the logs associated with these transactions from any from any layer. And you can and you can see that and start and start debugging. Or, if you're less lucky, you might have to start debugging earlier because something goes wrong. So what happens when when the code fails and and you're not there looking at it?
Well, that's where sort of error tracking comes uh comes into play. That's the standard uh uh part of any application performance monitoring. There are some services that that uh specialize in it. If you've drunk coffee here you might you might know we'll talk about it later And it's kind of again the one case where you have you have very good experience with errors when when you encounter them locally because you have the Django debug view, you have you have the excellent trace back there, you see the value of all the variables. In production You can get that too. That's part of what this is what this is about. Where you see the traceback, you can see where that error originated.
and what were potentially the values of the variables there. So the idea here is again to replicate the experience that you're used to from localhost. the the developer experience that allows you to to develop the code in the first place and make sure that you can use that after you've moved to production as well and you no longer have physical access to to the environment and you're no longer the first uh the only user because there might be people who have different experiences, different setups, etc. And it's impossible for you to always try to replicate it blindly. You need something to catch that error for you and give you as much information
as as possible. So those are all the key components of a good observability system. So uh just to just to sum it up, the best uh kind of experience that you can get from this is if you have a single system that does all of these things for you. So the logs, the metrics, the APM, because it allows you to switch between them and and see and do exactly what I described, which is I see an error. Give me all the log messages that were associated with that transaction. And show me the APM data, show me the spans, show me the the the calls that that code made before
before it before it exploded. And that sort of multiplies the overall benefit that you get from these systems. Because if you have to open one page to look at the metrics and another page to look at the logs and a third page for the APM Again, as humans it's very hard to connect this and it's just manual labor that nobody wants to do. That's why we invented computers in the first place, to get rid of tasks like these. Make use of it. And finally, don't stop with uh with just the technical data. I talked uh uh about context a few times, how you should uh, for example, track which user it was. But it can go as it can go a step further, which is
tie it to your tie it to your business data. You can actually use the same system to answer some business questions That's that's the first thing. Like if you if you let's say run a magazine website or a newspaper, you can easily annotate all of the transaction with like What article were the people reading? Who is the author of that article? And you can immediately from the same visualizations that you can use to display which is the most popular browser, you can immediately answer the question, who's your most popular author? What are the topics that people are interested right now? It doesn't have to all be technical because on the technical side it's all just data. It's just different annotations, different dimensions of your data that you might want to slice and dice as you wish.
Okay, now quickly let's just run through the specifics. So as I mentioned, I'm I'm doing this using ElasticStack because it was just the default for me Except for the uptime, I just use status cake, I haven't I don't know anything about them. It just worked. I I It was part of a blog post that I read to to set it up. I ran it, it worked. I never looked at it twice. I don't care about those those things because it just works. It's a very simple question, yes or no. They send me an email if it doesn't work. Awesome. Moving on. For logging, I just use FileBeat, a small open source agent written in Go that sits on my server, reads the JSON log file that's produced by struct
log. and ships it over to uh to Elasticsearch. And I also have some pre-built module that came with it, notably the Nginx and system modules. And I use Elastic APM as well. They have support for Python, they have support for Django, they have support for React. So all of the things that I needed came out of the box. And this is what it what it costs me to run this system for a small deployment, for a single server, where everything is set up Word of warning, the two hours is actually correct, but I've been doing this exact thing with Elastic Stack for six years straight for a living. So there might be difference. This is the theoretical sort of optimal time
for implementation. It just it is possible. But obviously your mileage may vary. If you have any questions, like any specific questions with your deployment or need any help, I'll be around. Just grab me, I'll be happy to help and try to get you closer to the two hours. But I'm just saying it is possible. And uh what are the what are the other s other solutions out there? Uh uh if if um you're not specifically tied to to the ElasticStack. So first of all, there are two uh there are two uh open source cloud native initiatives OpenTracing, which was later folded into OpenTelemetry, which is a set of essentially standards and tools to implement all of these.
And then there are different different tools out there. So Sentry is the is one of the best known ones for Python. They do the APM, they do the error tracking really well. They pay for coffee, what's not to like. And then there are other most of these. So Sentry you can host yourself, Elastic you can host yourself, all the relevant parts are open source. For a lot of these others, it's just services that you just pay for instead of setting it up and running it, running it yourself. And obviously this is a very popular space. So uh just be on the lookout. There are there are a lot of cool companies solving this issue because it is it is an important issue So thank you.
I hope we have time for a few questions.
Observability is the way to answer questions about code running outside your local machine, where you cannot rely on debuggers, profilers, or direct server access. It helps you understand whether production is working and what it is doing when problems occur.
Discussed at 1:32Define what “working” means for your service and check it from the places your users actually connect from, not just from inside the server or data center. A status page can communicate both overall availability and the health of individual functions to users.
Discussed at 2:19Use structured logging, such as `structlog`, and preserve fields as JSON or another structured format instead of flattening them into human-readable strings. This makes logs searchable, filterable, and suitable for visualization rather than leaving you with an intermingled wall of text.
Discussed at 7:13Add context in middleware so every log generated during a transaction includes identifiers such as the user ID and email. You can then search for a user's records and see the experience that led to their problem.
Discussed at 8:01Start with measures such as request counts, response speed, and the 99th-percentile user experience, then make the monitoring more specific as you move from the operating system to the web server, database, or framework. Generic CPU and memory metrics can reveal that something is wrong, but targeted metrics are more actionable.
Discussed at 12:42APM instruments the application so it can observe what the code is doing, including calls to frameworks, databases, and external services. In Python, these tools commonly configure themselves by monkey-patching supported libraries such as Django, Requests, and Psycopg2.
Discussed at 15:04Use transaction traces to break execution into database calls, application code, framework code, and external services. This can expose issues such as spending more time establishing a database connection than executing queries, or show that most time is actually spent waiting on a database or third-party API.
Discussed at 17:26Use distributed tracing to correlate browser activity, API calls, backend work, and database operations in one trace. The correlation is typically carried through special HTTP headers, making network time and other delays visible from the user's end-to-end perspective.
Discussed at 20:36Error tracking can capture the traceback and potentially the values of variables at the point where the error occurred, providing a production equivalent of Django's local debug experience. Combining the error with its trace and associated logs gives you context even when you cannot reproduce the user's environment.
Discussed at 23:42A unified system lets you move from an error to the related logs, transaction spans, and calls made before the failure without manually correlating separate tools. This reduces the human effort required to connect different views of the same incident.
Discussed at 25:16Yes. Business attributes, such as the article being read or its author, can be attached to transactions and used to determine popular authors, topics, or other user behavior from the same data used for technical analysis.
Discussed at 26:49Note: We understand that names change, people change, and bodies change. We respect each individual's journey and privacy. If you have any concerns about a video or need us to remove content, please don't hesitate to contact us. We will handle your request with care and promptly address any issues.

Published June 13, 2025

Published June 13, 2025

Published June 13, 2025

Published June 13, 2025

Published June 13, 2025

Published June 13, 2025

